
.
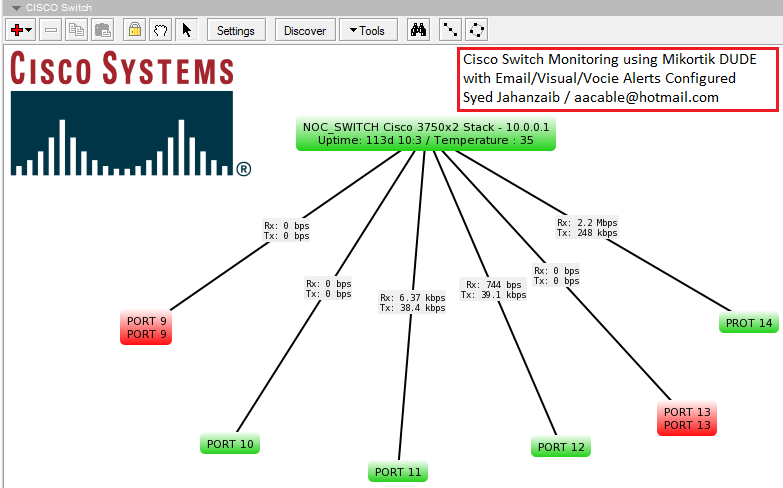
In my network, I have few Cisco switches at various departments connected via FIBER optics. Recently we were having issue of network connectivity in between various switches and devices. I already have a very good setup of Mikrotik base DUDE monitoring system, but it shows only the SWITCH availability status on the screen, I wanted to have a good visual for switch ports too.
I found few ways to accomplish this task using DUDE functions, scripts, etc, but found following method is very simple to start with . It also sends me email when any port goes Down or not in use.
Make sure your switch support SNMP , and SNMP agent is enabled at your SWITCH as well as at your DUDE to match the same. For simplicity you can use PUBLIC as a default community string in the switch. Also In this example I have used CISCO 3750 (in dual stack mode) and add only few ports just for example.
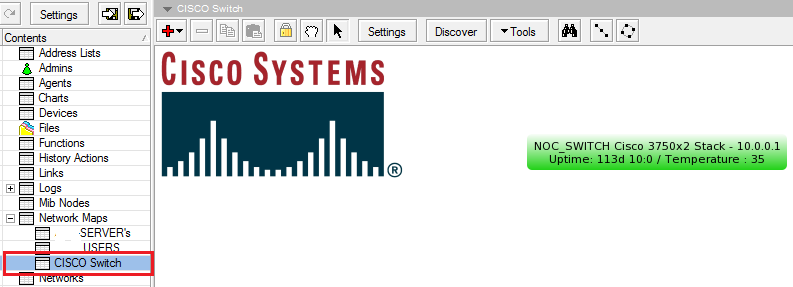
First add your switch in the map so that it can appear in the map as look like below.
As showed in the image below . . .
 .
..
.
Adding PROBE for port monitoring
Now to add PORTS monitoring, Open Dude,Goto PROBES and click on + sign to add new probe.
Use the following data.
Name = PORT 9
Type = SNMP
SNMP Profile = Your SNMP Profile
Oid = iso.org.dod.internet.mgmt.mib-2.interfaces.ifTable.ifEntry.ifOperStatus.10109
Oid Type = integer
Comapre method = ==equal
Integer Value = 1
As showed in the image below . . .
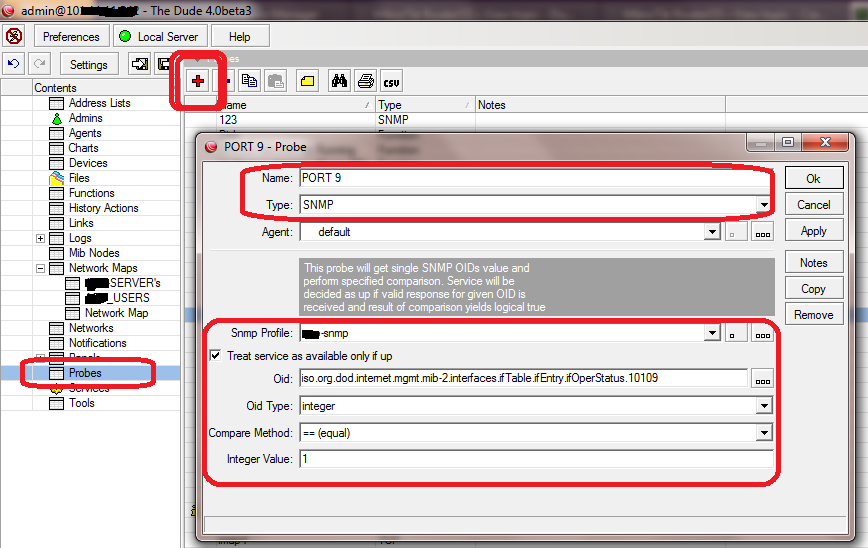
Note: Change the OID number to match the port number on your switch , for example I am monitoring port number9 which value is 10109 . You can use SNMPWALK via DUDE to check the OID’s for different ports of your switch.
Now click OK to save
.
.
Adding Switch PORT separately using IP and PROBE
Its time to add PORTs in your map so they can appear separately as showed in the title imageGo back to your MAP,
Right click and ADD new device,
Type your switch IP address, and click on Next,
Now DO NOT click on Discover , simply click on + sign
In PROBE, Select the PORT 9 probe you created earlier
and click on Apply/OK
As showed in the image below . . .
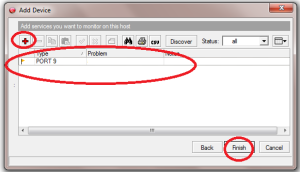
Click on Finish.
.
.
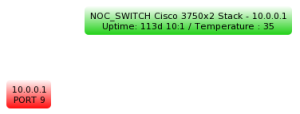
Now you will see something like below . . .
As you can see the port number 9 is down , so the status is shown correctly.
.
.
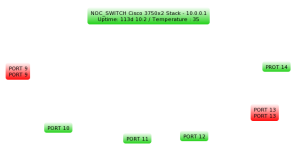
Now you can repeat the same procedure to add as much ports you like to monitor.
Something like below image . . .
.
.
.
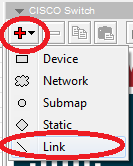
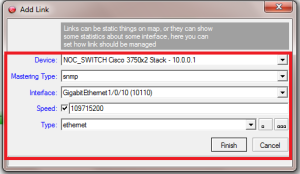
Adding LINKS to monitor port usage
You can also add LINKS to show the port usage :)As showed in the example below . . .
.
.
.
After adding ports / snmp links, and other enhancements , you can see something like below image . .
.
 .
..
.
I will add more methods to monitor the ports. For more info , please read more at following links
http://forum.mikrotik.com/viewtopic.php?f=8&t=46928
http://forum.mikrotik.com/viewtopic.php?t=46419


0 comments:
Post a Comment